Dashboards
As of version 4, eva is bringing built-in Dashboards with key metrics to analyze the virtual agent’s performance so you can gather information and insights that can add value to your business. In this chapter, you’ll learn about the key metrics and charts displayed in the latest Dashboard section and how to easily custom them using filters.
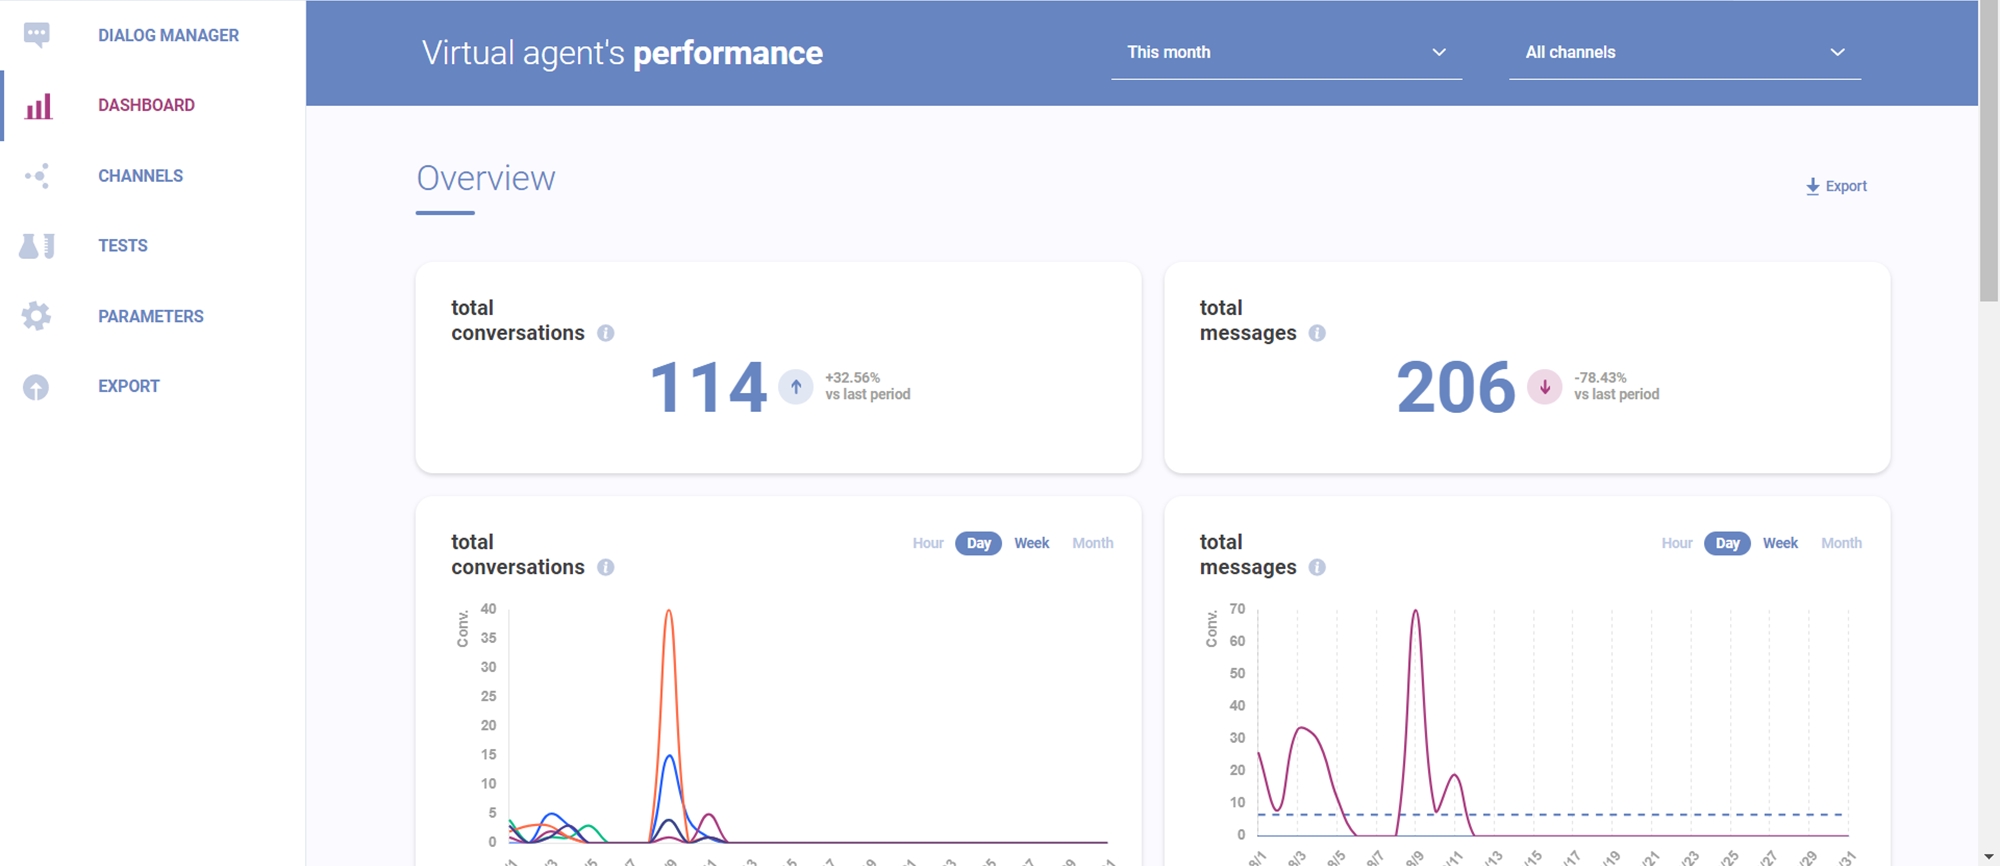
To access it, proceed to the side menu and choose the bar chart icon (image below).
Last updated
Was this helpful?