Dashboards
Metrics will help you understand if the virtual agent is successfully performing the conversations you have designed and achieving your business goals.
Drop-off points, engagement rates, accuracy, total users, and other data are vital to analyze the performance of your virtual agent. By understanding these patterns, you can make data-driven decisions to enhance the user experience and achieve your goals more effectively.
Syntphony CAI provides built-in Dashboards with key metrics to analyze the virtual agent’s performance so you can gather information and insights that can add value to your business. In this chapter, you’ll learn about the key metrics and charts displayed in the latest Dashboard section and how to easily custom them using filters.
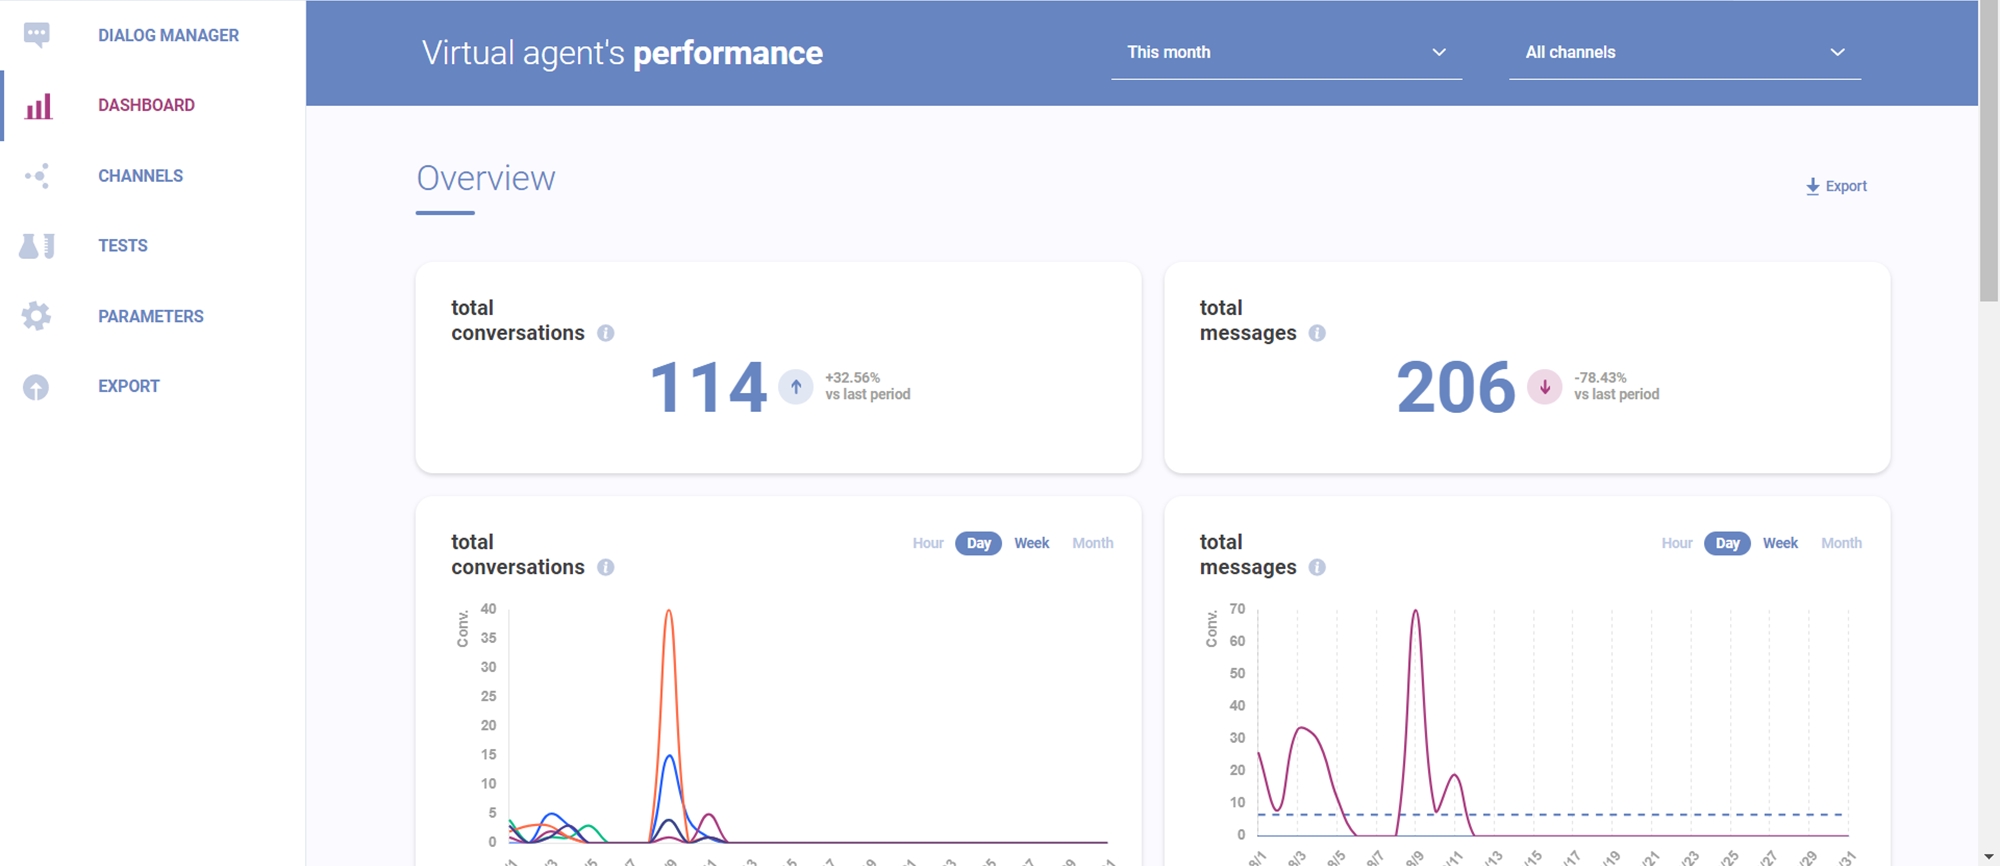
To access it, proceed to the side menu and choose the bar chart icon (image below).
Last updated